EconLens Join the free beta

Sneak peek · Inside the app

How EconLens translates a CPI morning.

Once a month, one number briefly runs the entire financial conversation. Here's a real report translated the EconLens way — next to the actual app screens that do it.

Every event, on one home screen

The app tracks the economic calendar for you — CPI, Fed decisions, jobs day, GDP and more — and gives each event a plain-English card: what it is, what happened, and how much it matters. No tickers, no jargon walls.

Below is how a real CPI morning reads, using the June 2026 report.

Report shownJune 2026
ScheduleMonthly · 8:30 ET
Market impactHigh
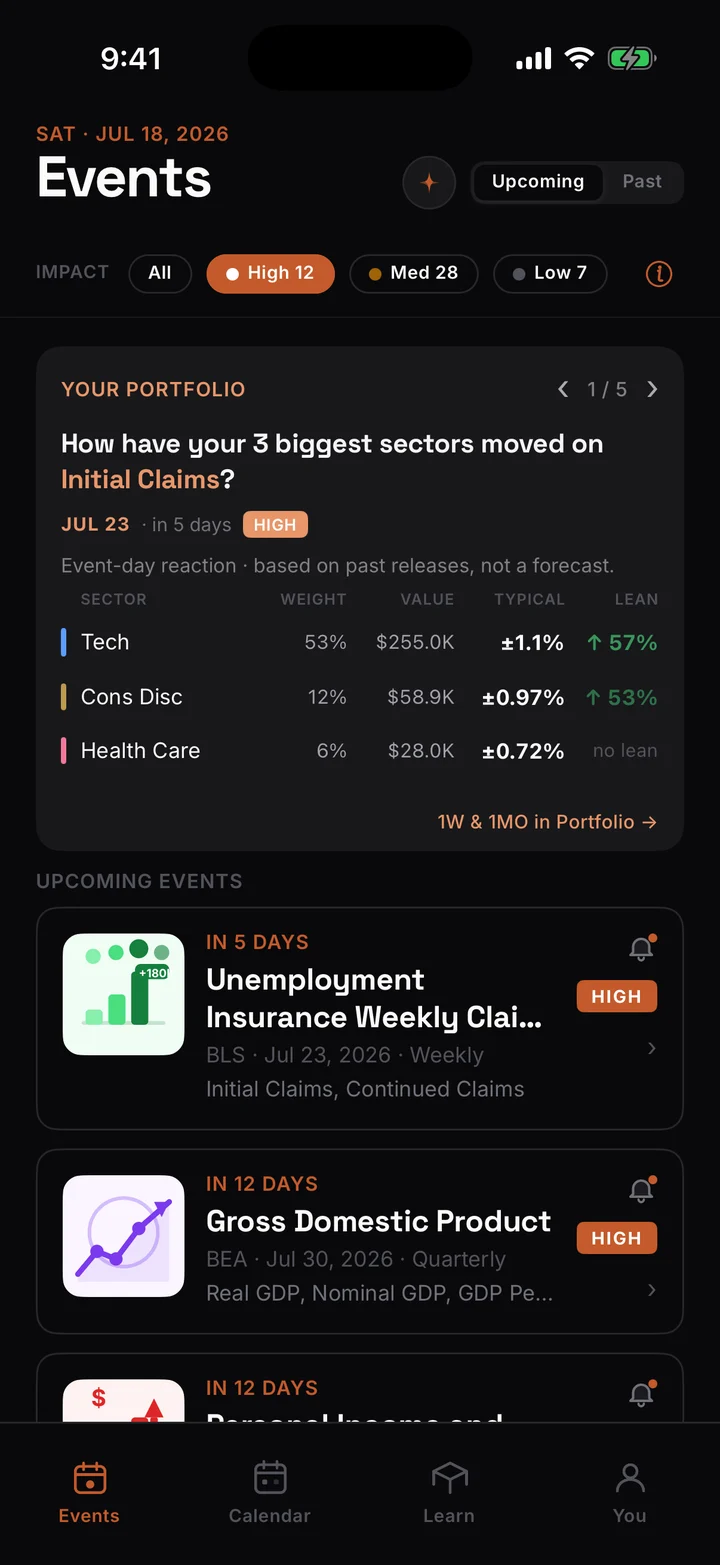
EconLens Events feed listing upcoming releases as plain-English cards with impact badges
The Events feed — portfolio figures are sample data

What CPI is

The Consumer Price Index measures the average change over time in the prices urban consumers pay for a market basket of goods and services — groceries, rent, gas, haircuts, plane tickets. A healthy annual inflation rate, the one central banks target, is typically around 2%: stable growth without runaway price erosion.

A real report, translated

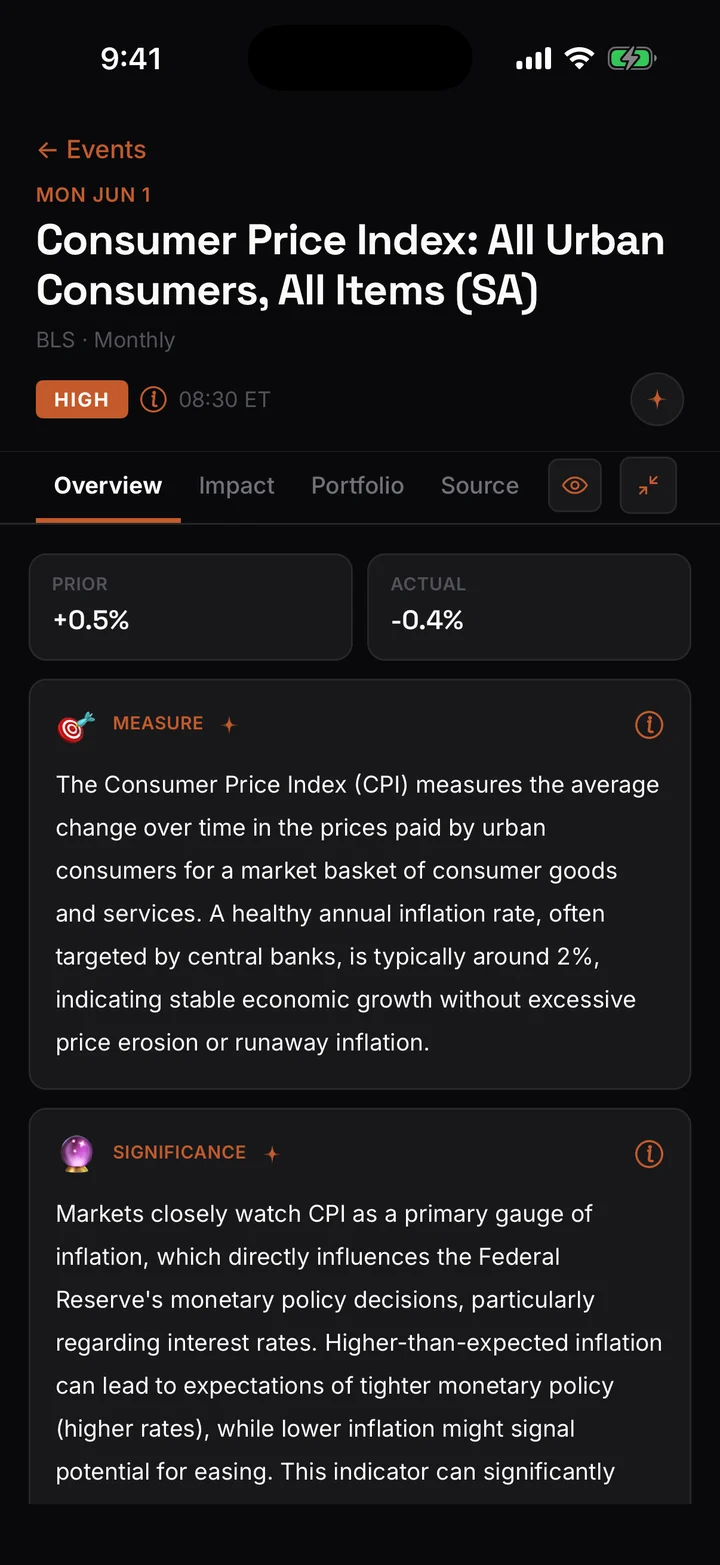
June (m/m)−0.4% May (m/m)+0.5% Index332.6

CPI declined, signaling disinflation. The headline index fell to 332.6 from 333.9 — an outright monthly price decline, which pulled annual inflation down to about 3.5%.

In the app, every event gets this treatment automatically the morning it lands — the Overview tells you what happened and what it means.

This is the same June report translated on this page — the screenshot is the app showing it live.

EconLens event screen for the June 2026 CPI report: prior +0.5%, actual -0.4%, with Measure and Significance explained in plain English
The June CPI report in the app — Overview tab

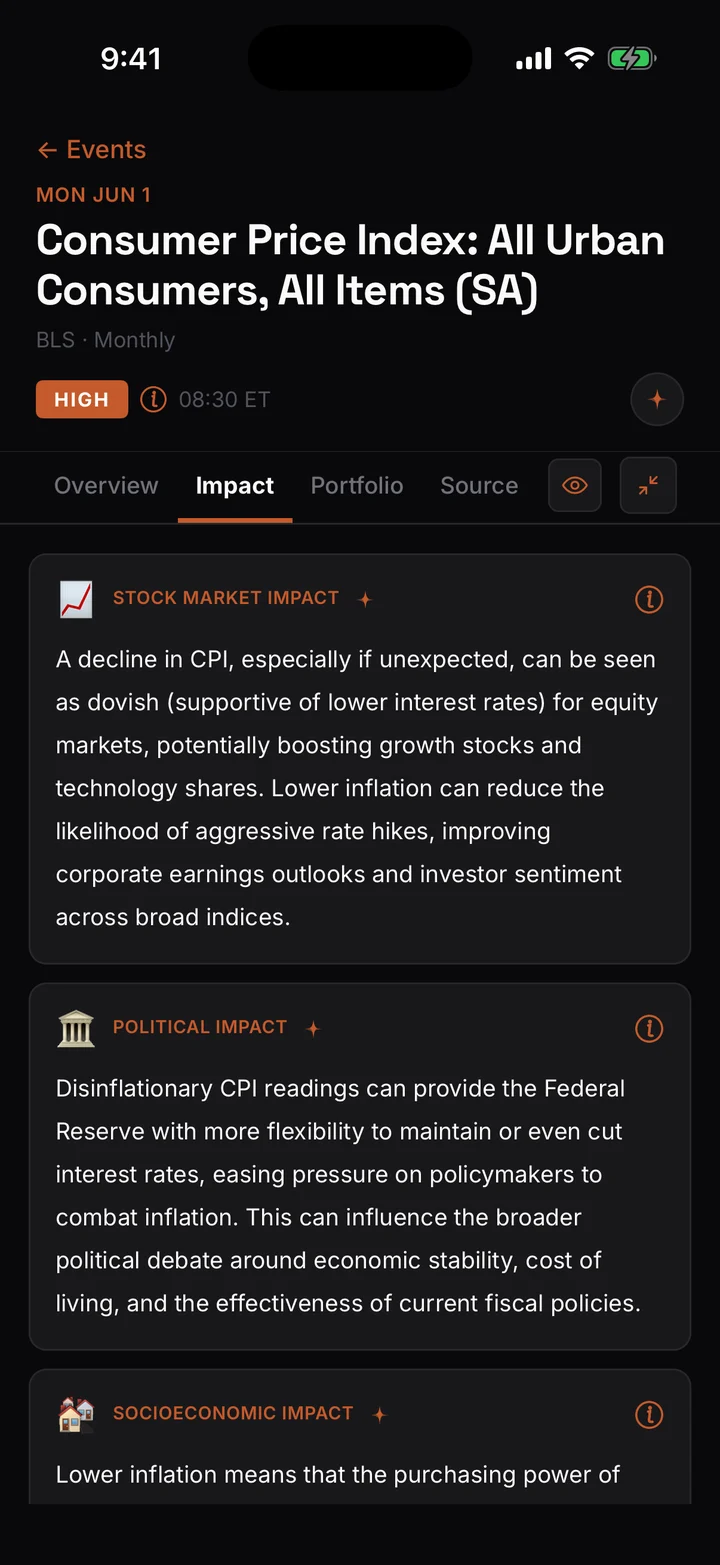
The Impact tab — six angles on every release

Each event also gets a full Impact analysis: six dedicated read-outs — stock market, political, socioeconomic, real estate, energy & commodities, and consumer spending — with citations for every claim, along with the full editorial brief and longer chart history.

The stock-market and political read-outs shown here are the exact analysis quoted later on this page — written by the same pipeline, the morning the report landed.

EconLens Impact tab for the June 2026 CPI report showing Stock Market Impact and Political Impact analyses
The Impact tab — June CPI
Line chart of U.S. year-over-year CPI inflation from 2017 to June 2026: near 2% pre-pandemic, peaking around 9% in 2022, settling near 3% through 2025, and 3.5% at the June 2026 reading.
Year-over-year change in the Consumer Price Index. Source: FRED (CPIAUCSL), through June 2026.

Why markets stop to watch it

Markets treat CPI as the primary gauge of inflation, which directly shapes the Federal Reserve's interest-rate decisions. Hotter-than-expected inflation has fed expectations of tighter policy; cooler inflation has signaled room for easing. That's why a single decimal point can sway bond yields, equity prices, and overall risk appetite — the market isn't reacting to prices themselves, but to what the Fed might do about them.

And then — your portfolio

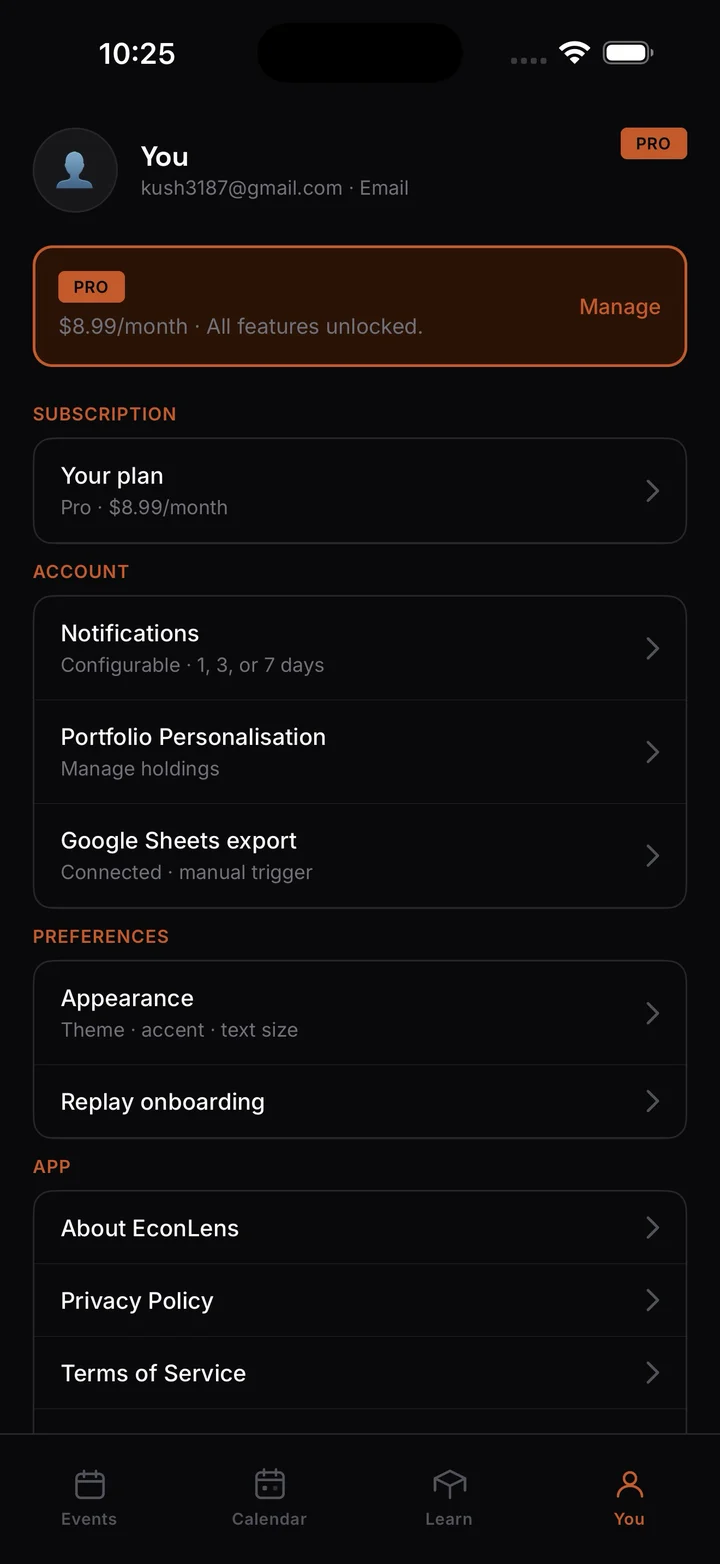
This is the part no article can do. Connect your brokerage read-only (or build a watchlist) and EconLens measures your actual dollar exposure by sector — then tells you, in plain English, which of your holdings a report like this has historically moved, and by how much.

The generic story lives on the web. The personal one lives in the app.

EconLens You screen showing portfolio sector exposure in dollars
Your real exposure, in dollars

See it with your own portfolio.
EconLens is free while in beta. Historical patterns, not forecasts.

Join the free beta

Historical patterns, not forecasts. EconLens is not investment advice. Data: U.S. Bureau of Labor Statistics via FRED. Sample report translated by the EconLens pipeline from public economic data.