See the translation.
“Core CPI rose 0.3% m/m against consensus of 0.2%, a hawkish surprise that repriced front-end rate expectations.”
“Prices rose faster than experts predicted. That usually pushes the Fed toward keeping interest rates higher for longer — historically a headwind for tech stocks, which make up 51% of this portfolio.”
Sample portfolio data, shown as an example. Historical patterns, not forecasts. EconLens is not investment advice.
Android — coming soon.
EconLens launches on iPhone first. Pre-sign up and we'll email you the day the Android app ships.
Sneak peek.
CPI, translated.
Once a month, one number briefly runs the entire financial conversation. Markets don't react to the number itself — they react to the gap between the number and what forecasters expected. In June 2026, prices fell 0.4% on the month when they'd risen 0.5% the month before — a surprise like that is exactly what moves markets…
Built by an outsider.
“EconLens was built by an outsider — someone who invests, reads the news, and can handle any amount of complexity, but kept feeling locked out of the economic conversation for one reason: nobody ever teaches the language. Every acronym assumed a course never taken. So they built the translation they couldn't find — and then built it for everyone else standing outside the same door.”
What's inside.
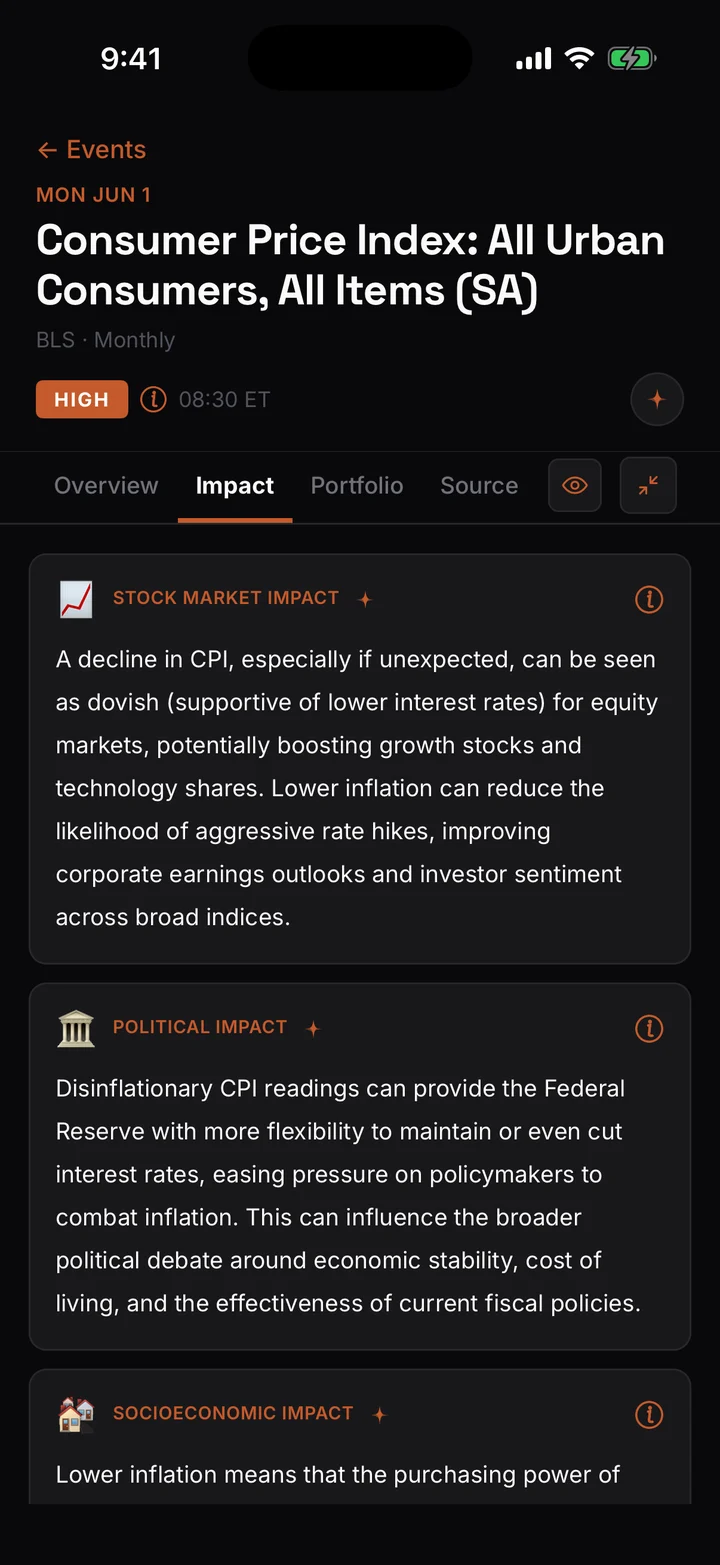
Impact
What a release means for markets — six read-outs per event: stock market, political, socioeconomic, real estate, energy & commodities, and consumer spending, with citations for every claim.
Portfolio
Connect your brokerage read-only (or build a watchlist) and see your own exposure — which of your holdings a report like this has historically moved, in plain English.
Straight answers on data.
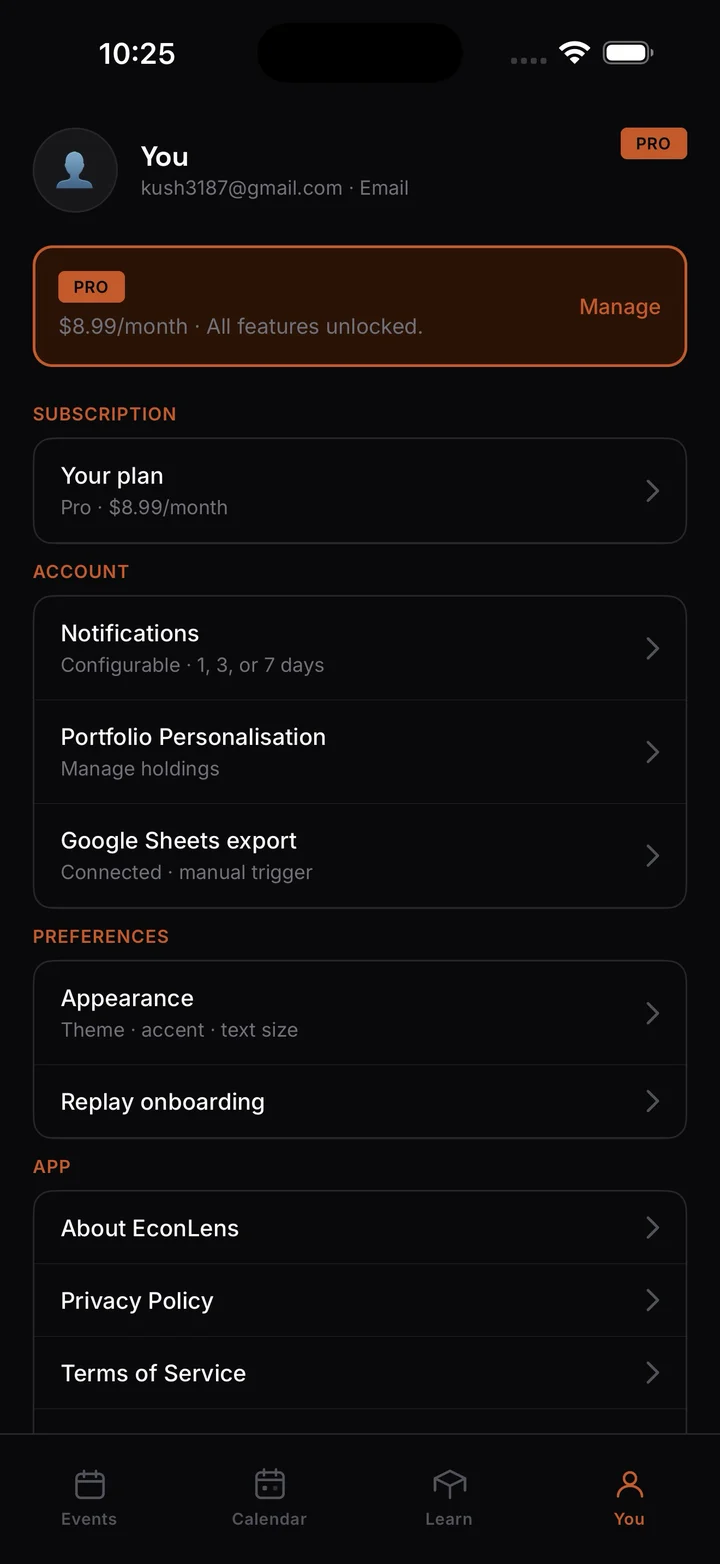
Read-only brokerage access via SnapTrade — EconLens never holds your credentials and never places trades. Sign in with Apple or Google. Your data is never sold. History-based insight, not investment advice.